

How to map your market for 2026 planning (with template)
Beyond TAM

It’s annual planning season. It’s time to revisit your market map.
Grab the spreadsheet template here. This newsletter offers a framework, process, and principles for an effective market map.
Most GTM leaders say they know their market. But when annual planning questions start, the cracks show.
Which segments should get more SDRs? How much more “room” do we have in mid-market? Should we keep selling to core Tech or expand to Financial Services? Which new geographies are actually worth investing in?
These “where do we play?” and “how do we win?” questions are the heart of strategy.
A clear market map can help provide answers.
What Market Mapping Actually Means
Market mapping isn’t top-down TAM sizing for your board deck.
It’s bottom-up insight about where opportunity concentrates within your serviceable market.
A proper market map answers:
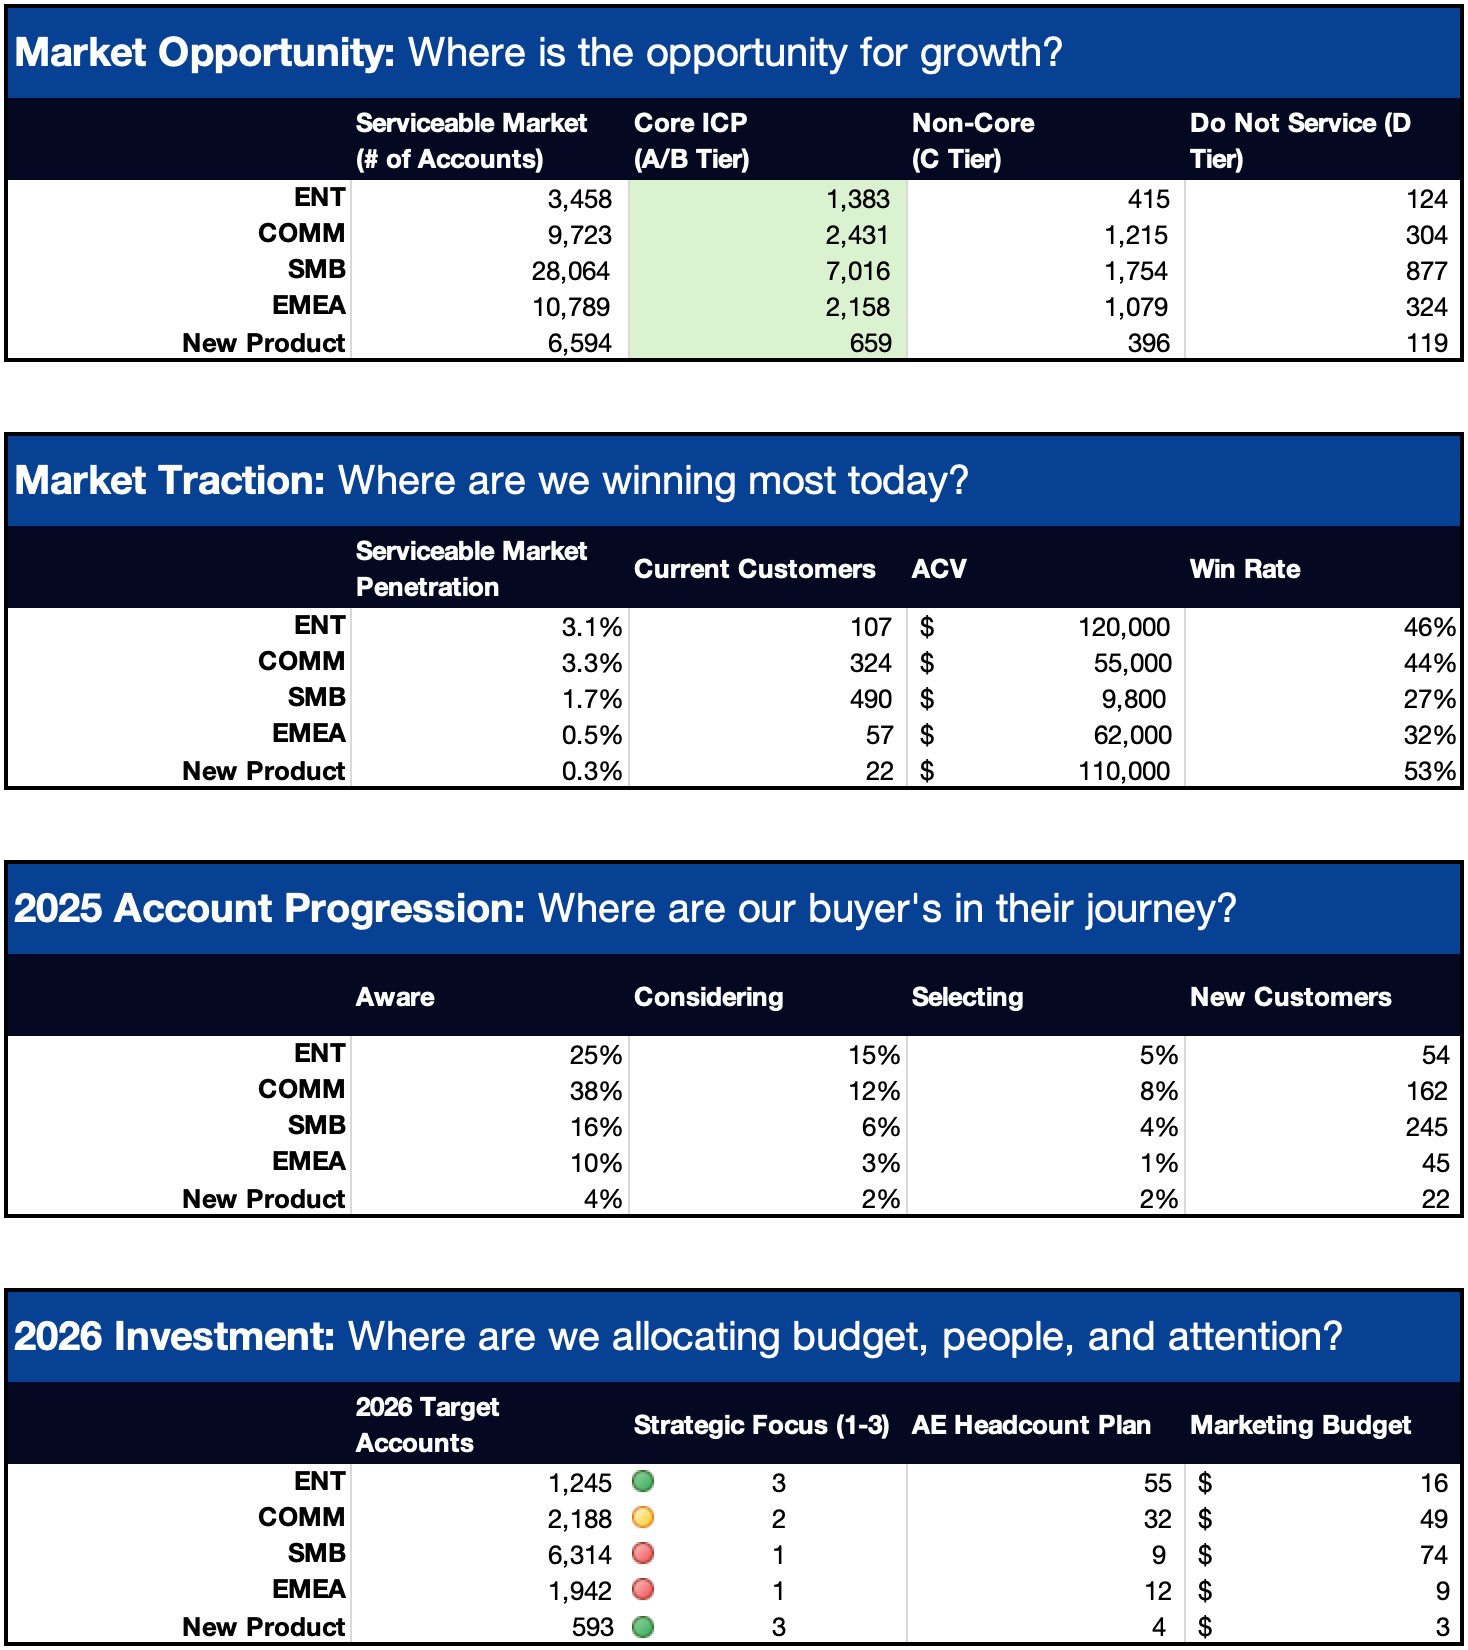
Where is the opportunity for growth?
Where are we winning most today?
Where are our buyer’s in their journey?
Where should we focus going forward?
Framework
Market mapping works in two levels.
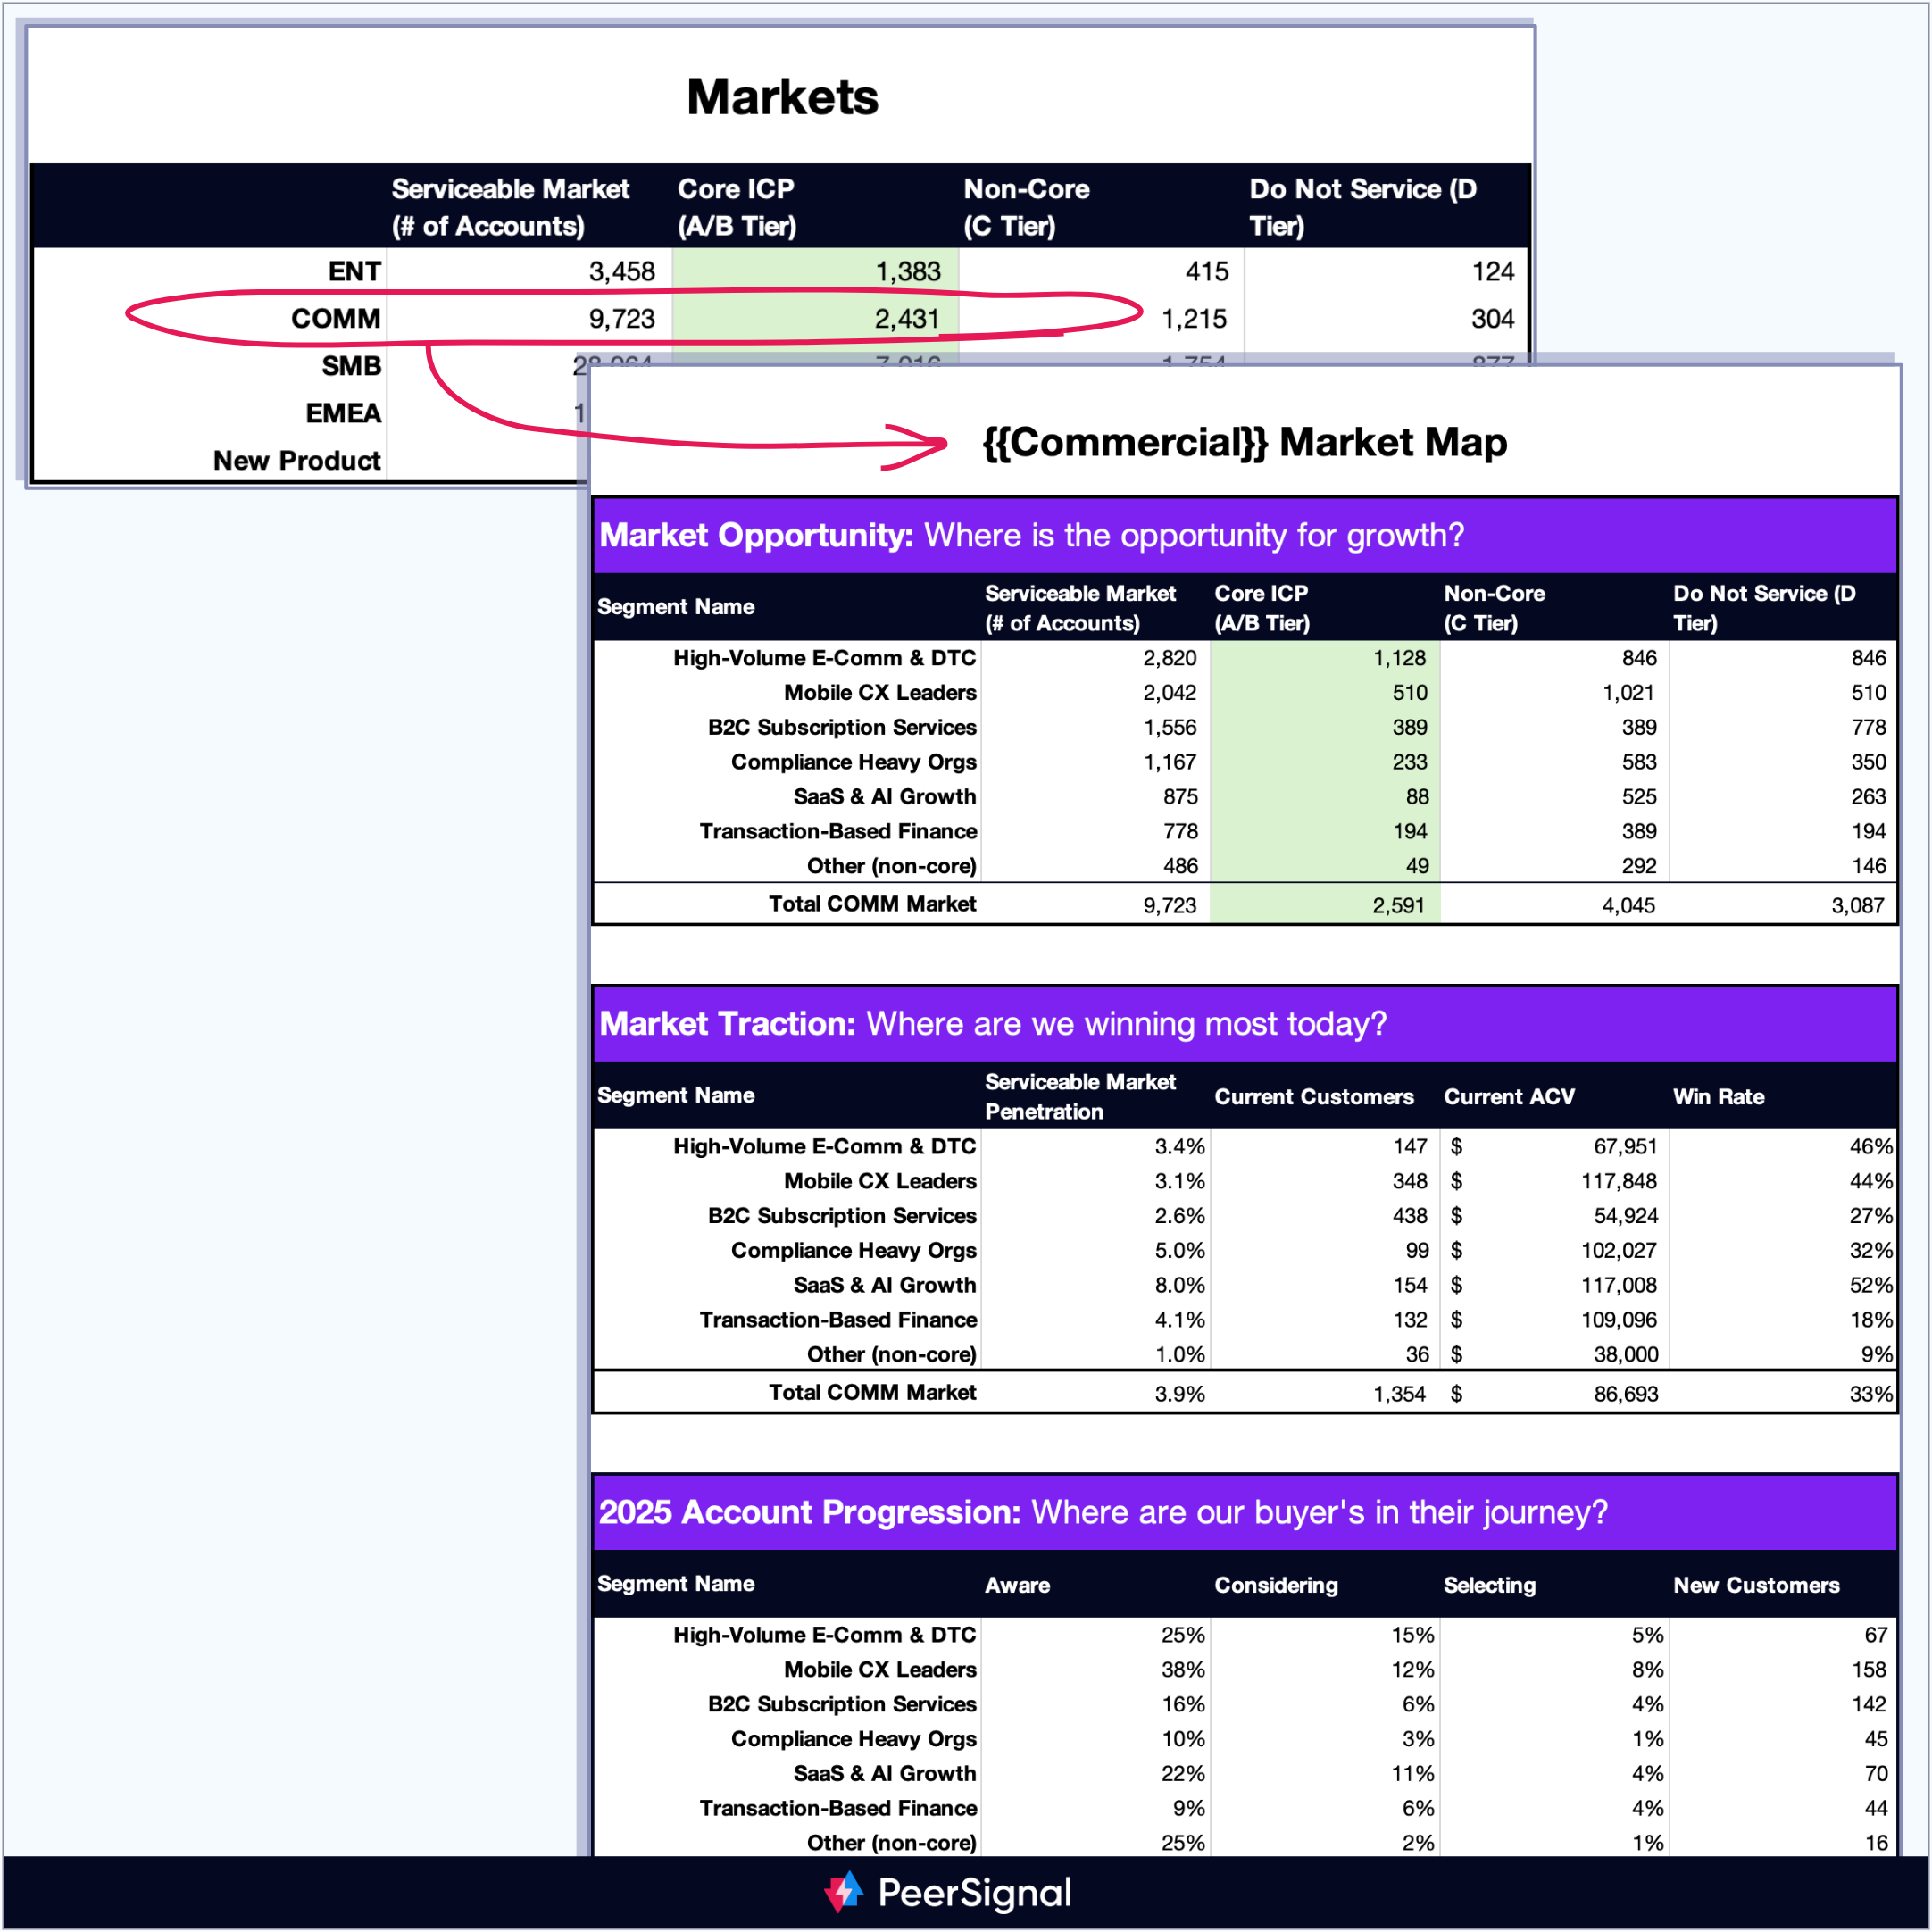
Level 1: Markets
First, break your business into top-level markets that you can serve.
Common market definitions:
Business units (Enterprise, Commercial, SMB)
Geographic regions (NAM, EMEA, APAC)
Product lines (Core Product, New Product)
Most companies use a combination.
Pick the market structure that maps to how you actually run GTM.
Level 2: Segments & tiers within each market
Within each market, you need segmentation and account tiering. Your Enterprise market looks different than your SMB market and your New Product market might also be distinct.
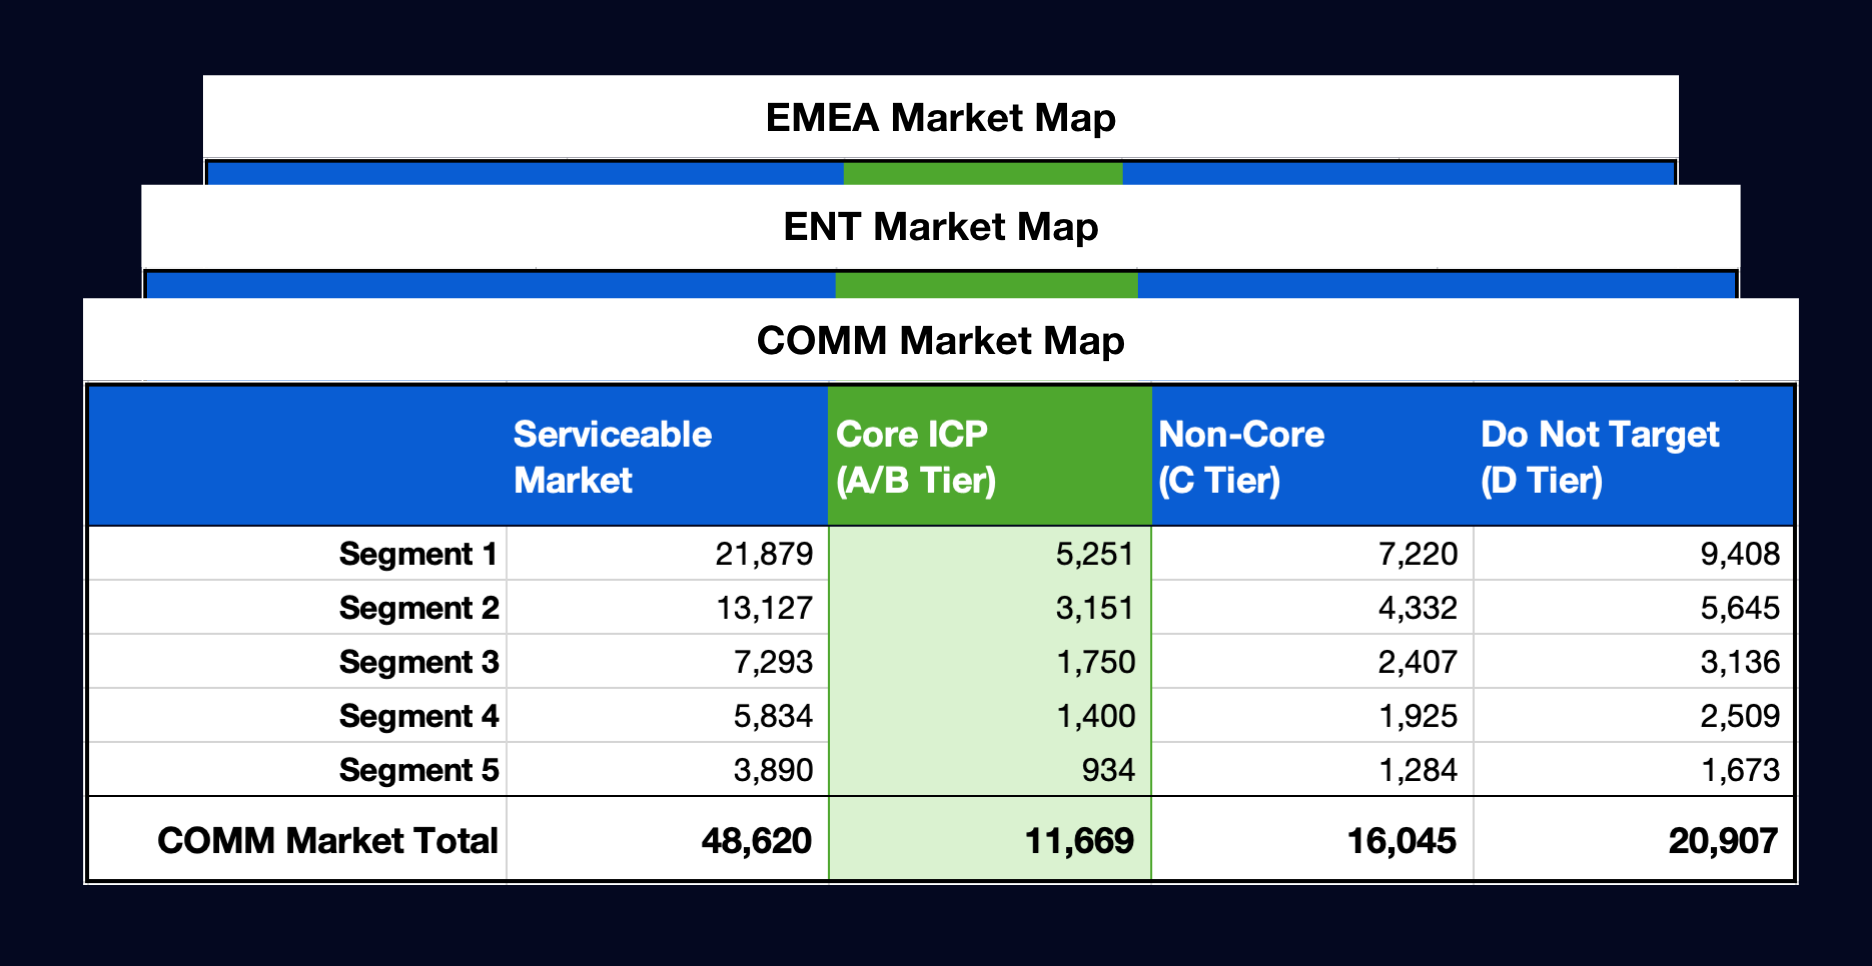
Segment by the dimensions that matter to you, not just NAICS and SIC codes:
Categories - Your own vertical or industry definitions.
Themes - Group by business situation or priorities.
Then tier accounts within each segment by ICP fit. A/B/C/D tiers based on your scoring model. This helps you move from “who can we serve?” to “who will we serve best?”
This two-level approach lets you understand hot spots at both levels:
Which markets get resources? (Enterprise US vs Commercial EMEA).
Which segments within each market? (Financial Services vs Tech within the Commercial business).
Use Your Map to Allocate Resources
Once you have your market map, you can act like an asset allocator.
You have finite resources: budget, headcount, executive attention. Your market map shows expected return by segment.
For each segment, evaluate:
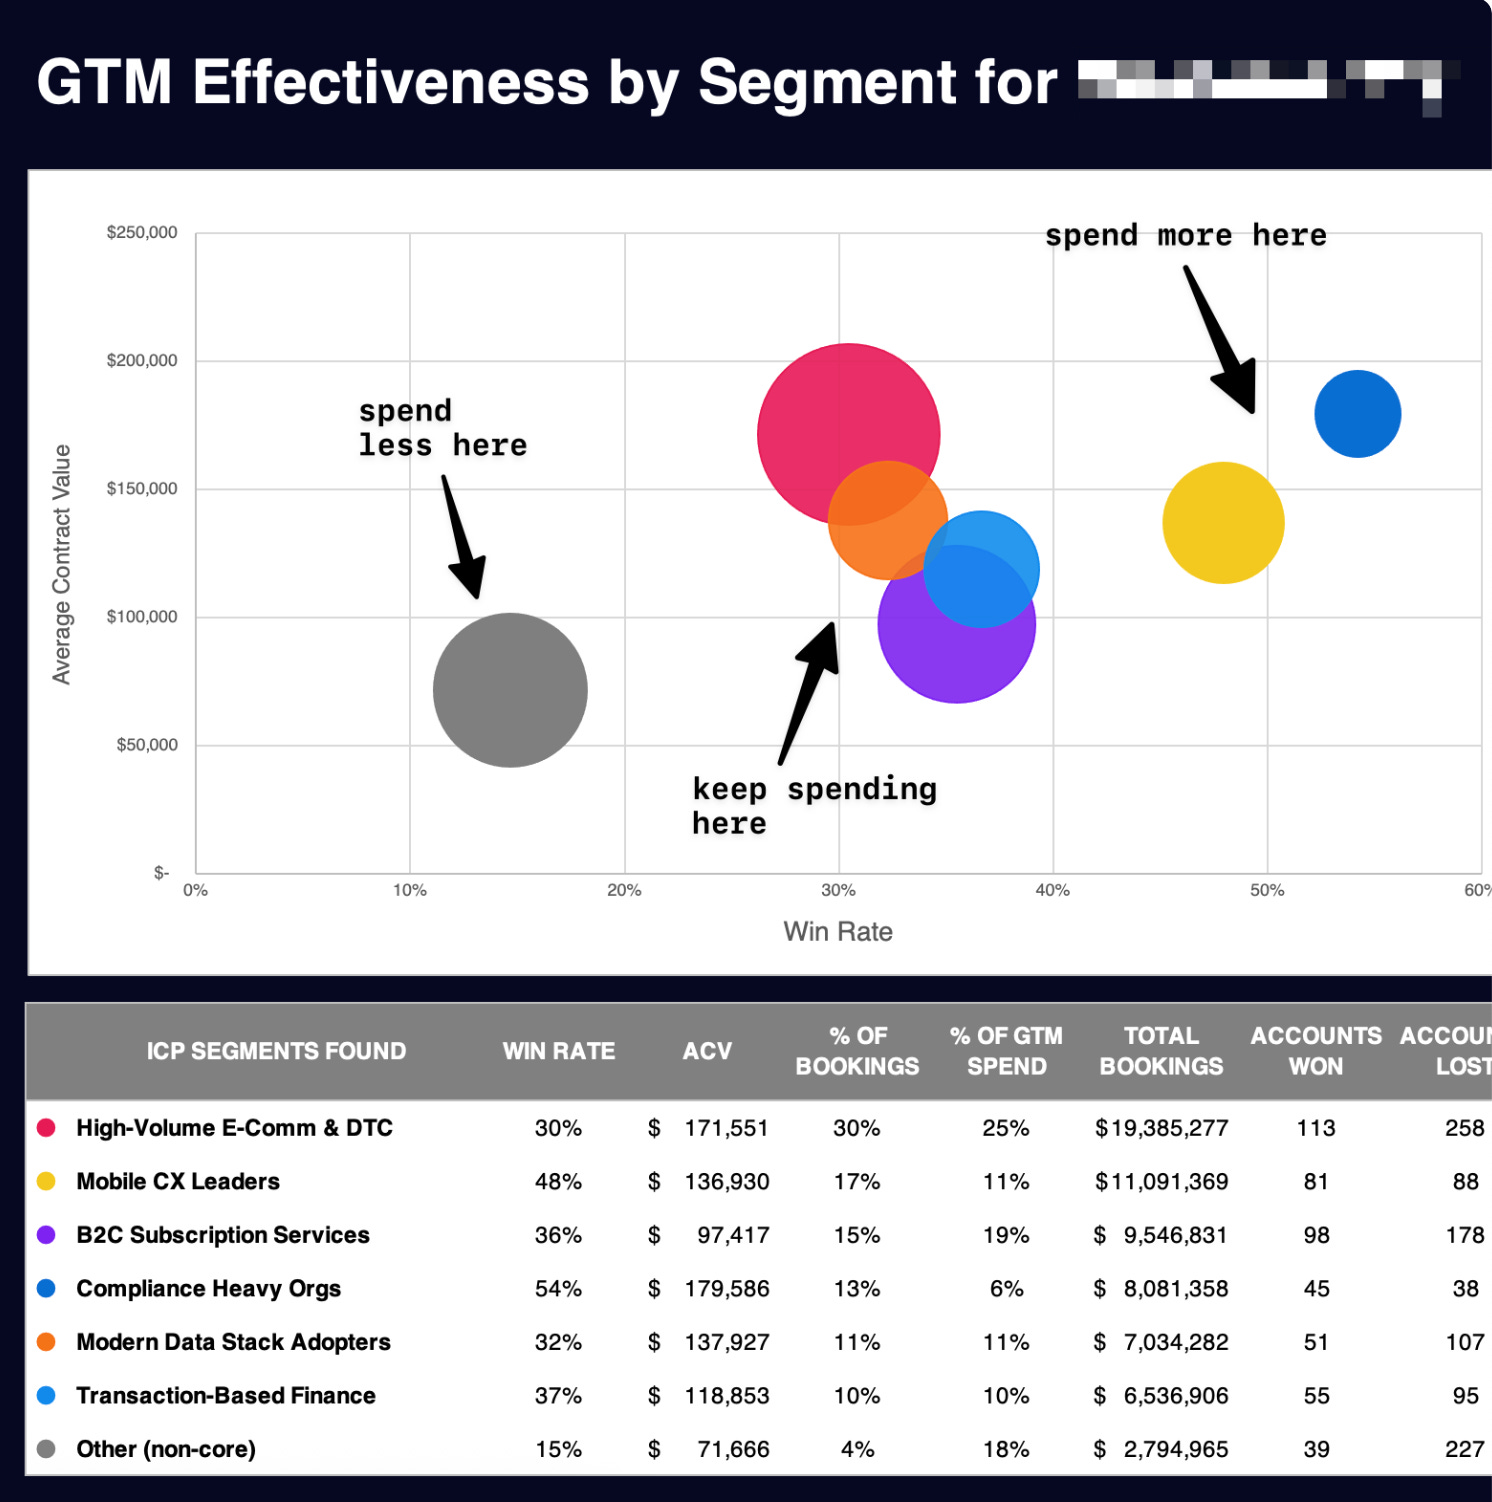
Opportunity size. How many A/B-tier accounts? What’s the revenue potential?
Current traction & success. Where do we actually close deals? Where do we win fast? Where do customers stick?
Investment required. What does it cost to acquire here? How much coverage do we need?
This gives you a simple ROI framework for every segment. Some segments are obvious wins. High opportunity, proven win rates, efficient GTM. Fund those fully.
Some are obvious passes. Small opportunity, low win rates, expensive to serve. Starve those.
The interesting decisions happen in the middle. Your market map makes these tradeoffs explicit.
The Output: Your 2026 Market Map
This becomes your strategic foundation.
Tyler Calder at PartnerStack showed what this looks like when executed well. They mapped their entire market, scored every account across 40+ signals, and tiered them A/B/C/D. Then they aligned their full GTM engine around those tiers.
The result: 34% drop in cost per dollar of pipeline created. 58% increase in pipeline value.
That’s the leverage of a good market map. It drives everything from board reporting to daily sales priorities.
Territory planning: Assign your best reps to your best segments. Stop wasting $300K OTE sellers on C-tier accounts.
Marketing budget: Allocate spend by segment priority. Create segment-specific campaigns.
Expansion decisions: That new vertical opportunity? Check the map. If Financial Services doesn’t include enough ICP accounts, it might not be the best bet.
Three Principles for Better Maps
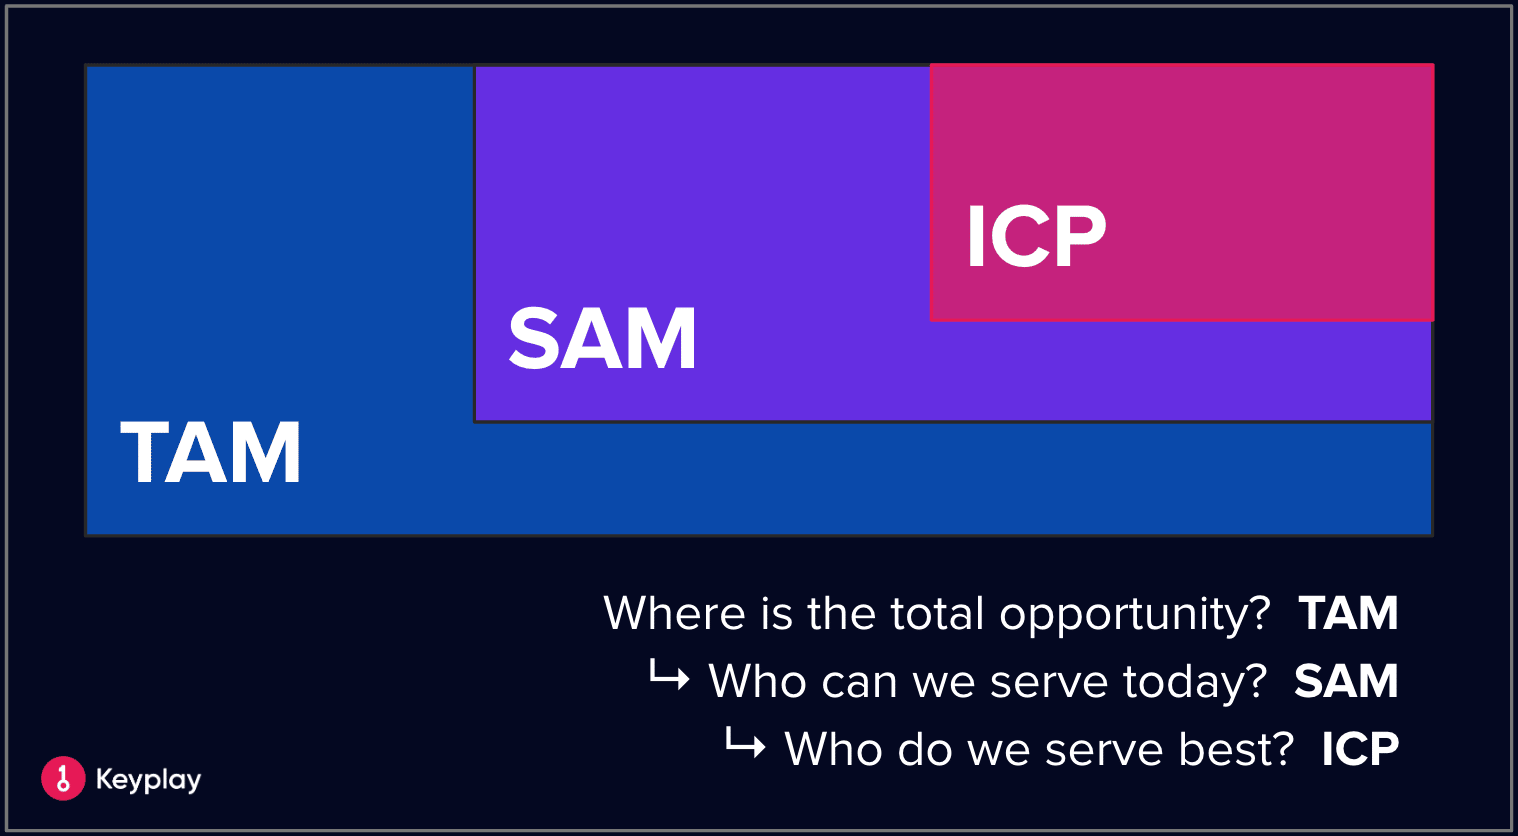
1. Don’t confuse TAM with ICP
Your TAM slide shows investors scale. Your ICP defines who you serve best. Your market map shows where those ideal customers concentrate. All three matter. Don’t mix them up.
TAM is great for strategy. Market maps drive operations.
2. Definitions before data
Before you can map your market, you need a clear ICP definition. Most companies have fuzzy, off-base, or stale ICP definitions. That makes market mapping impossible.
Start with one of three proven frameworks:
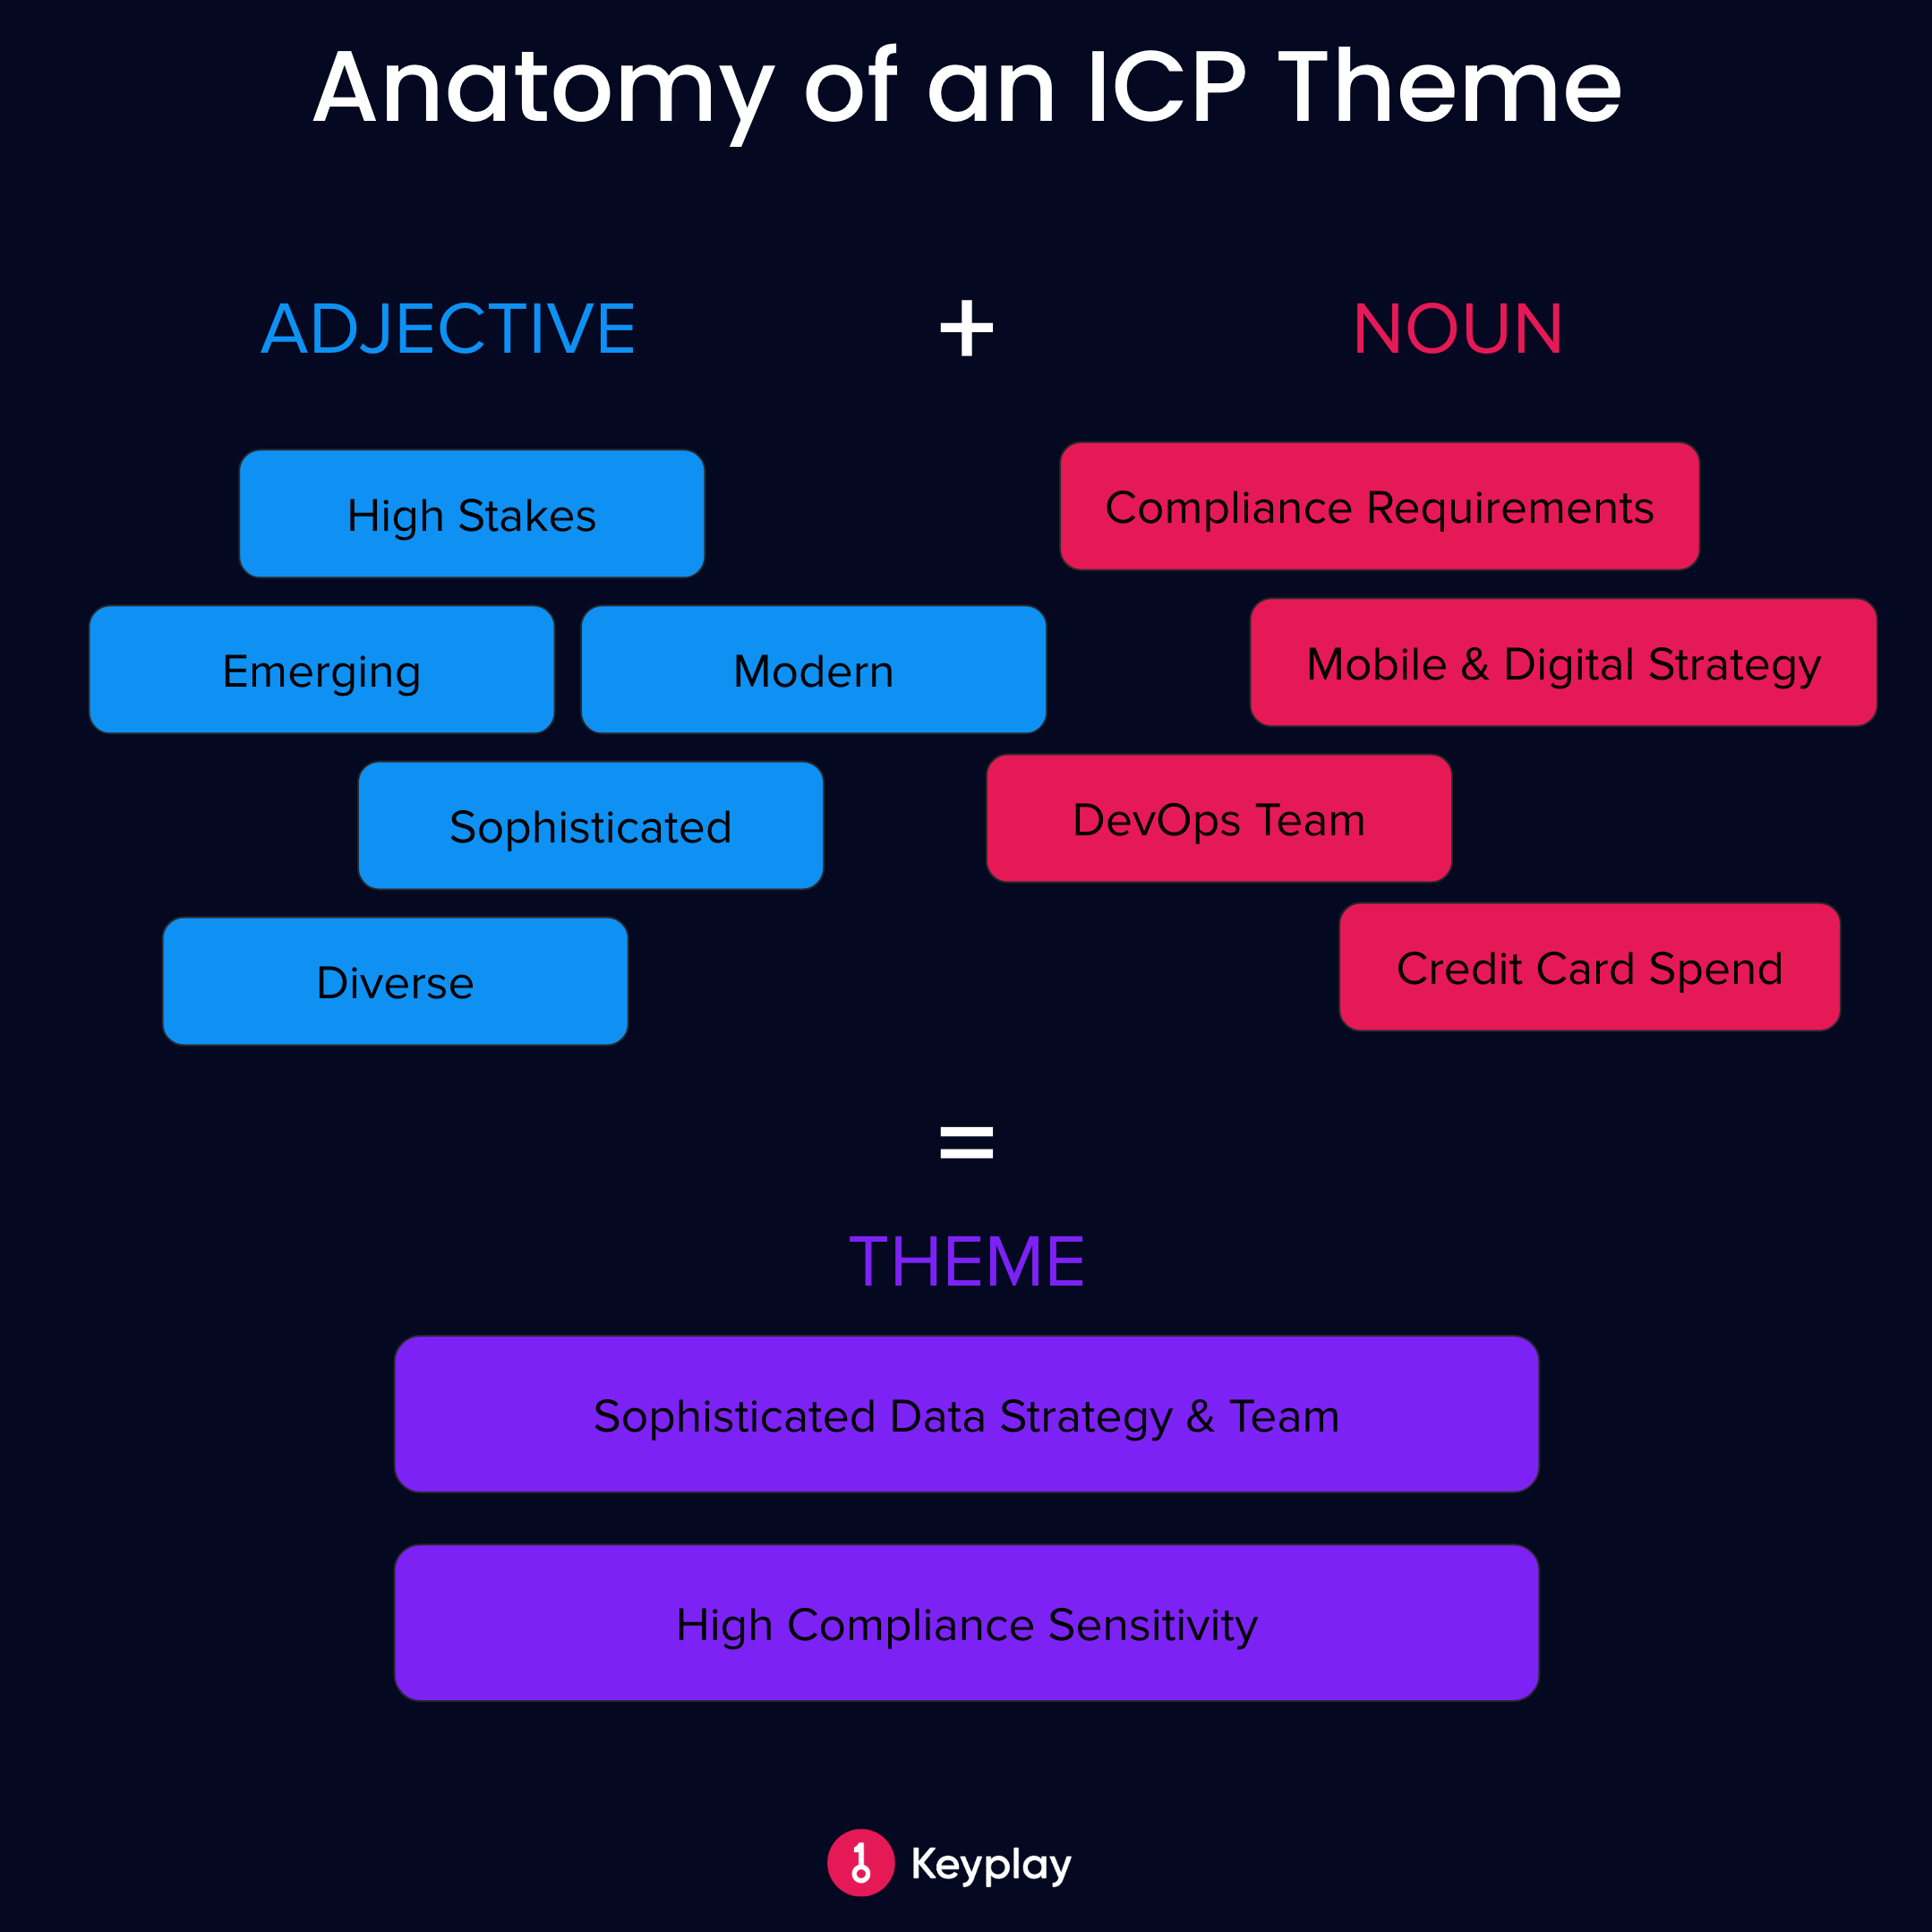
Attribute-Based ICP (breaks down fit into firmographics, situation, organization, technology)
Theme-Based ICP (identifies business themes that indicate fit)
ICP Paragraph (distills your ICP into a concise narrative)
3 proven ICP definition templates here
Once you have a clear definition, translating it into a market map becomes much easier.
3. Program, not a project
Markets shift. Your product evolves. Treat market mapping as an annual program, not a one-time project. Build the map in Q4. Test it in Q1. Adjust throughout the year. Rebuild next Q4.
Why This Matters Now
2026 planning is happening right now across B2B. Most companies will set targets based on “grow 30% everywhere.”
The winners will pick their spots.
They’ll map their market. Score the segments. Focus resources on the highest-potential opportunities.
Market mapping isn’t sexy.
But it’s the difference between spray and pray and strategic focus.
Want help mapping your market for 2026? Request a demo of Keyplay and we’ll help you get the data.